Freemium
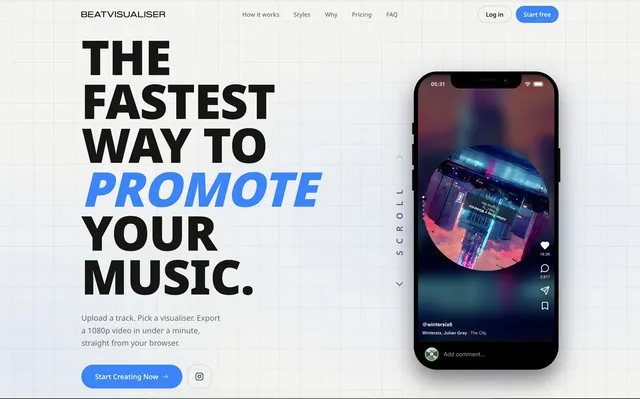
Turn your music into audio-reactive videos for YouTube, Reels and TikTok, with custom visuals and 1080p 60 FPS export.
WebFeatured Visualisers contains paid promotional placements.







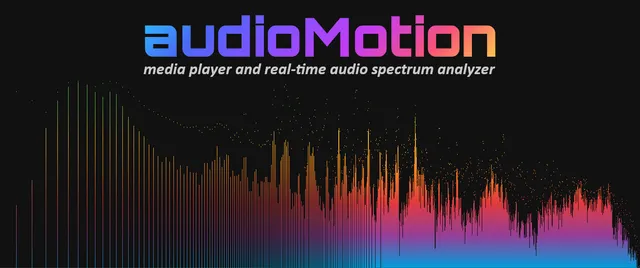
High-resolution real-time spectrum analyser available as a web music player and a JavaScript library.
Web · Open sourceAvee PlayerAndroid music player with a customisable visualiser editor and video export, popular for template-based visualisers.
Android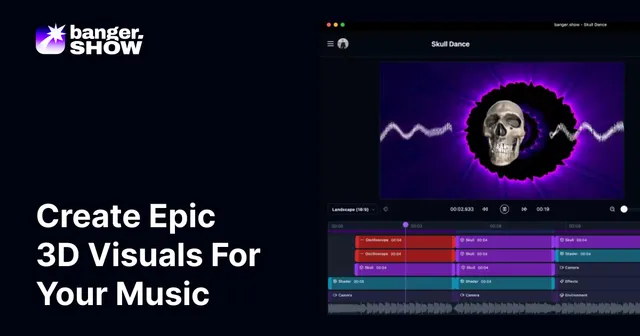
Online 3D music video editor with audio-reactive visualisers, templates and Spotify Canvas tools.
WebTurn your music into audio-reactive videos for YouTube, Reels and TikTok, with custom visuals and 1080p 60 FPS export.
WebConsole-based audio spectrum visualiser for Linux, macOS, FreeBSD and Windows.
Linux · Mac · Win · Open sourceCavalierGraphical Linux audio visualiser for GNOME, built on the cava engine.
Linux · Open sourceEchoWaveOnline video editor with music visualiser and audiogram tools offering 50+ reactive effects.
WebAI music visualiser and music video generator for web and Android that creates beat-synced clips.
Web · Android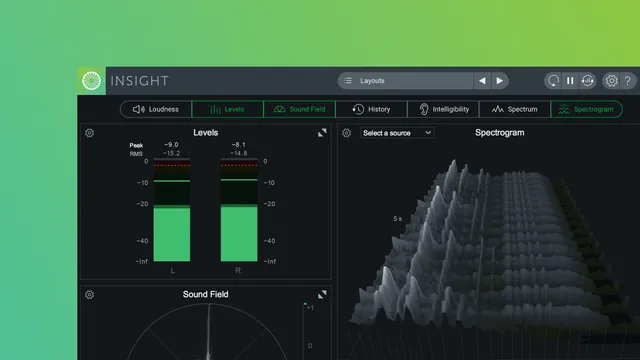
Metering and audio analysis plugin with spectrum, scrolling 2D/3D spectrogram, sound field and loudness meters.
Win · MacModular, node-based software for building audio-reactive visuals for live shows and rendered music videos.
Mac · Win
Compact audio metering app and plugin suite with waveform, spectrum, spectrogram and oscilloscope views.
Win · Mac · Linuxmusicvid.orgFree, open-source online music visualiser for making visualiser videos in the browser.
Web · Open sourceBeginner-friendly creative coding library whose sound add-on provides FFT and amplitude analysis for visualisers.
Web · Open source Renderforest
General online video platform with a dedicated range of music visualisation templates.
Web
Automated music video maker that cuts footage and audio-reactive visualisers to the structure of a track.
Web Sonic Visualiser
Free, open-source application for visualising, analysing and annotating audio recordings.
Win · Mac · Linux · Open sourceBrowser-based music visualiser and lyric video maker aimed at musicians, producers and labels.
Web Spectra
Inexpensive iPhone, iPad and Mac music visualiser app that exports up to 4K 60fps video.
iOS · Mac TouchDesigner
Node-based visual programming environment widely used for audio-reactive installations and live visuals.
Win · Mac
After Effects plugin that converts frequency ranges of an audio track into keyframes for animation.
Win · MacModular live visuals software for macOS with audio analysis, BPM detection and a large ISF shader ecosystem.
Mac
Template-based online video maker with a large library of music visualiser and lyric video templates.
Web
Free real-time audio visualiser in the browser that reacts to microphone, files or shared system audio.
Web Vizzy
VizzyOnline music visualiser and lyric video editor that renders on your own computer.
WebFree, open-source media player with built-in audio visualisations including spectrum, scope, Goom and projectM.
Win · Mac · Linux · Open source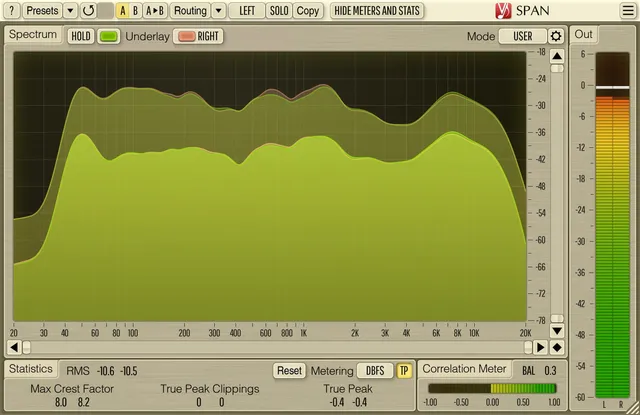
Free real-time FFT spectrum analyser plugin for mixing and mastering.
Win · MacOpen-source recreation of Winamp 2 in the browser, including a MilkDrop visualiser window.
Web · Open source ZGameEditor Visualizer
Audio-reactive video plugin included with every edition of FL Studio, for creating and exporting music visuals.
Win · MacA spectrum visualiser splits audio into frequency bands, typically using a Fast Fourier Transform (FFT), and draws the energy in each band. Low frequencies are usually on the left and high frequencies on the right, so kick drums and bass move one end of the display while cymbals move the other.
The same principle appears in decorative video visualisers, such as circular bar spectrums on electronic music uploads, and in technical spectrum analysers used for mixing and mastering.
It shows the level of each frequency in the audio at a given moment, usually with frequency on the horizontal axis (often on a logarithmic scale) and level in decibels on the vertical axis.
FFT (Fast Fourier Transform) is the algorithm most visualisers use to convert a short window of audio samples into frequency bins. Each bin represents the energy in a narrow frequency range, which is then grouped into bars or drawn as a curve.